Using COMPASS ID for scientific discovery
What a researcher actually does here: deposit a paper, have its metadata generated and then review it, and read the atlases for what nobody has covered. This walkthrough was run against the live system, and the outputs shown are the ones it returned.
COMPASS ID has two halves. One is the set of published evidence atlases, which read a whole field and report where research has and has not been done. The other is an account, where you deposit your own work and have it structured the same way. They are the same system: a gap is only measurable if every record in the corpus carries the same fields, and your paper is one of those records.
This post walks the researcher half end to end. Everything below was executed against the live API while writing, so the outputs are real rather than illustrative.
1. The account
Registration takes an email, a password of at least twelve characters, and optionally a name and institution. You choose at sign-up whether your profile is public, and can change that later in settings.
The account is issued a COMPASS ID, which is a short readable phrase rather than a number. The test account created for this post was alpine-salmon-peak-azure. It is meant to be quotable in a paper or a grant application the way an ORCID is.
2. Depositing a paper
A deposit starts from a DOI. The record carries the ordinary bibliographic fields, title, abstract, year, journal and authors, and then the part that makes it useful to a gap analysis: a block of COMPASS metadata.
- Framework alignment, required, at least one entry. These are the policy frameworks the atlases index against: the SDGs, CBD targets, CITES, Ramsar, UNCCD and the IUCN Red List.
- Ecosystem type, from a closed list of eleven values.
- Taxon scope, as scientific names with their rank.
- Methods, and the temporal range the study covers.
- Geographic scope, as text and as coordinates.
Where a field has a closed list, the server enforces it rather than the form merely suggesting it. Submitting tropical forest instead of Tropical Forests comes back rejected, with the eleven permitted values named in the error. That is deliberate and it is the whole point: free-text metadata cannot be counted, and a field nobody can count is a field that cannot show a gap.
3. Having the metadata generated
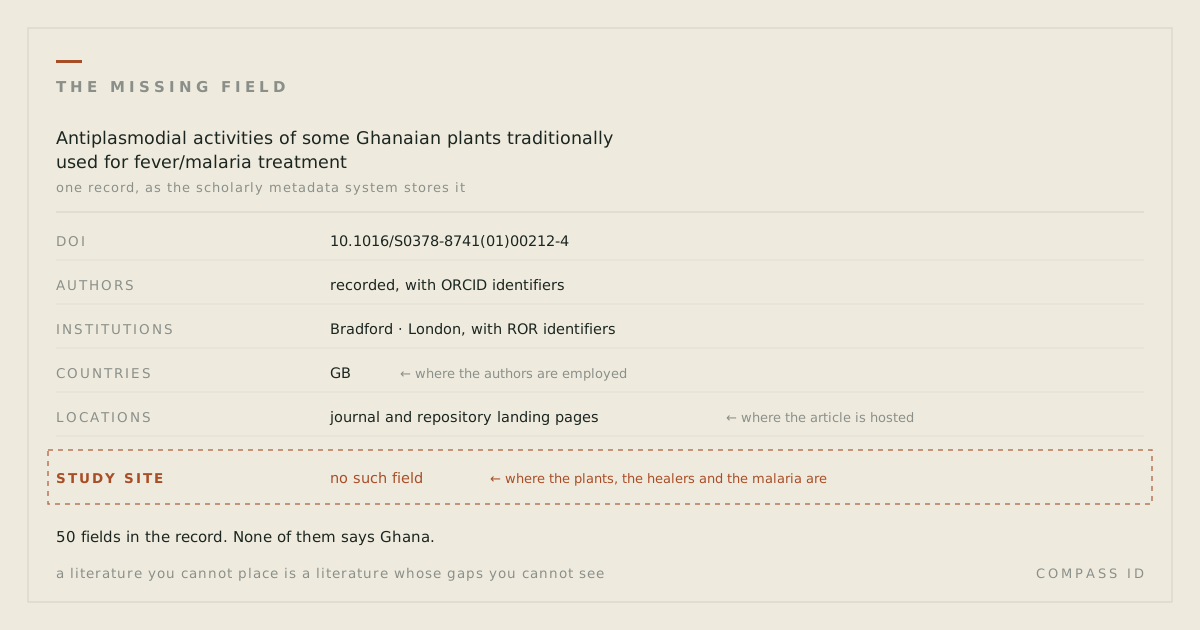
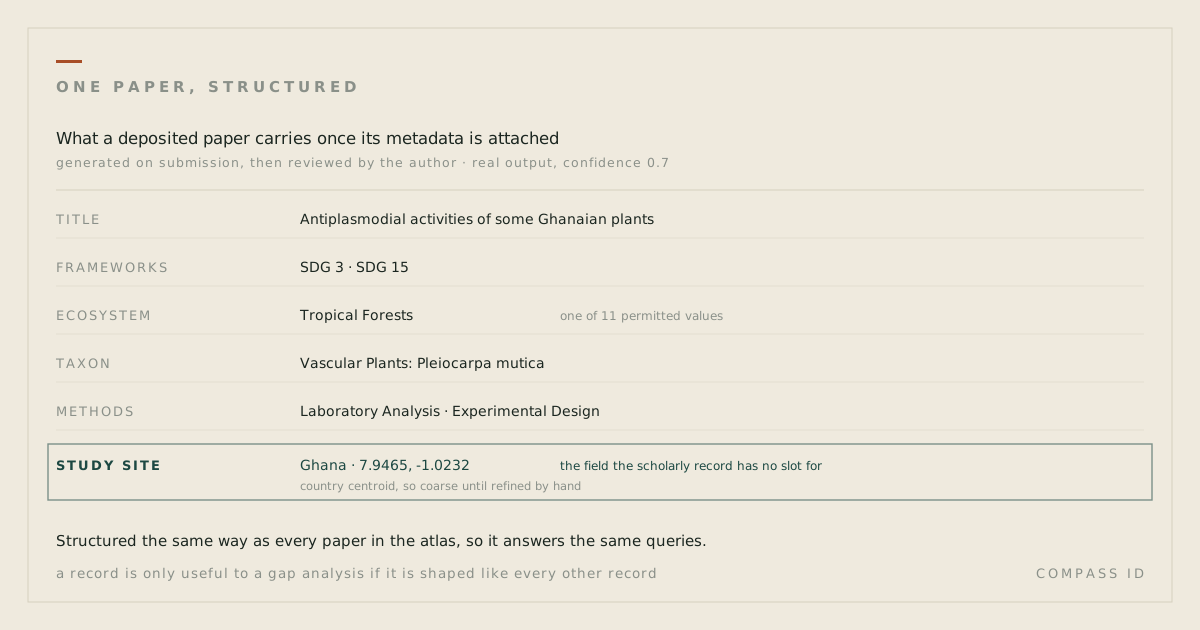
Filling that in by hand is tedious, so the record can be generated and then reviewed. Running it on a 2001 paper about Ghanaian antimalarial plants returned this:
frameworks          SDG 3, SDG 15
ecosystem_types     Tropical Forests
taxonomic_coverage  Vascular Plants: Pleiocarpa mutica
research_methods    Laboratory Analysis, Experimental Design, Controlled Experiments
location            Ghana, 7.9465, -1.023194
geographic_scope    Local
confidence          0.7
Three things about that output are worth saying plainly.
It carries a confidence score and a written rationale. A metadata value with no stated confidence invites more trust than it has earned, and the rationale is what lets an author judge whether the model read the paper or read the title.
It writes to the record, so read it before you move on. On this run the generation step replaced the method the author had entered by hand, in vitro screening, with its own three, and added SDG 15 to the single framework that had been submitted. Both are defensible readings of the paper. Neither was the author's. Treat generation as a fast first draft that you then correct, not as a step you can skip.
And the location it produced, 7.9465 by -1.023194, is the centroid of Ghana: honest, and coarse. A paper whose fieldwork happened at a named forest reserve deserves that reserve's coordinates. Refining it by hand is worth the minute it takes, because the resolution of your point is the resolution at which your work can answer a spatial question later.
4. Reading the atlases
The published atlases are open without an account. Each one opens as an interactive map of geolocated study sites with the tag filters beside it, and the same few moves do most of the work.
- Filter and watch the blanks. Every count on screen is computed from the data, and an empty result is a finding rather than a failure.
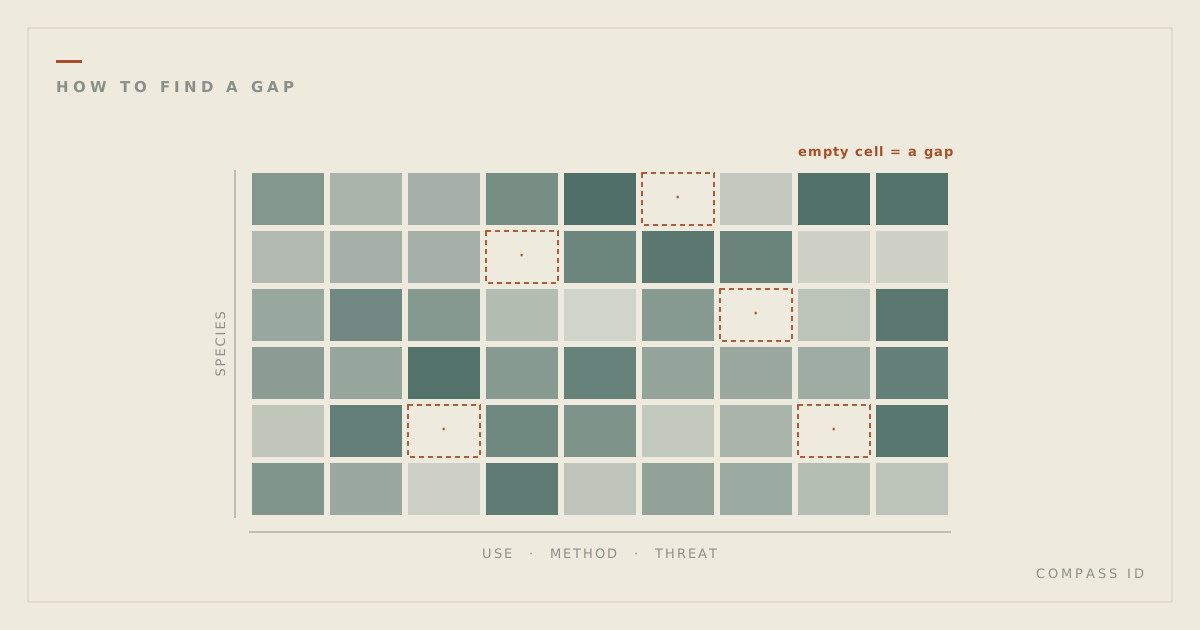
- Cross two dimensions. The gap matrix crosses any two tagged dimensions; an empty cell is a pairing no study in the field has addressed.
- List and export. The papers tab is sortable and filterable, with CSV and BibTeX export, so a selection becomes a reading list.
- Ask in plain language. The assistant sets the filters from an ordinary sentence. It states the counts the page computed, never its own.
- Put the land underneath. Earth observation layers draw beneath the study sites, so research coverage and observed conditions can be read together.
The move that most often produces something new is the least glamorous one: filter to your own subject, then invert the question. Not what has been done, but what has the same shape as what has been done and has never been attempted.
5. What a fully tagged corpus makes possible
Everything above operates on the corpora we have finished. It is worth being explicit about what changes with scale, and equally explicit that this part is a projection rather than a result.
At the scale of one plant family the effect is already measurable. Apocynaceae has 5,851 accepted species, and 3,748 of them, 64.1%, have no indexed research at all. That number exists only because every species was loaded from a taxonomic authority first and then matched against the literature, so an absence is countable rather than merely unnoticed.
Extend the same treatment across a field and three things become ordinary queries rather than research projects in themselves.
A census of absence. Today, establishing that most of a family has no indexed research takes a dedicated build. In a tagged corpus it is a count. The interesting version is not the total but the cross-tabulation: which threatened species, in which countries, under which frameworks, have no evidence behind them.
Transfer between comparable places. Christie and colleagues measured that there is typically fewer than one study per intervention within 2,000 km of a given location. That distance is computable for any placed corpus, which turns "is there evidence near me" into a query with an answer.
Candidates instead of hunches. Where a property is recorded for most studied members of a group, the members of that group with no indexed research are testable candidates. The atlases already expose this, ranked by a Wilson lower bound so that four species out of four does not outrank twenty-four out of twenty-eight. It is a question worth asking, not a result, and the interface says so.
None of that requires a new idea. It requires the same structure applied to enough of the literature, which is a question of cost and time rather than method.
What this is not, yet
COMPASS ID is an early-stage prototype and it is more useful to say where the edges are than to imply there are none.
- Researcher profiles are in beta and full platform search is still in development. The published atlases are the finished part.
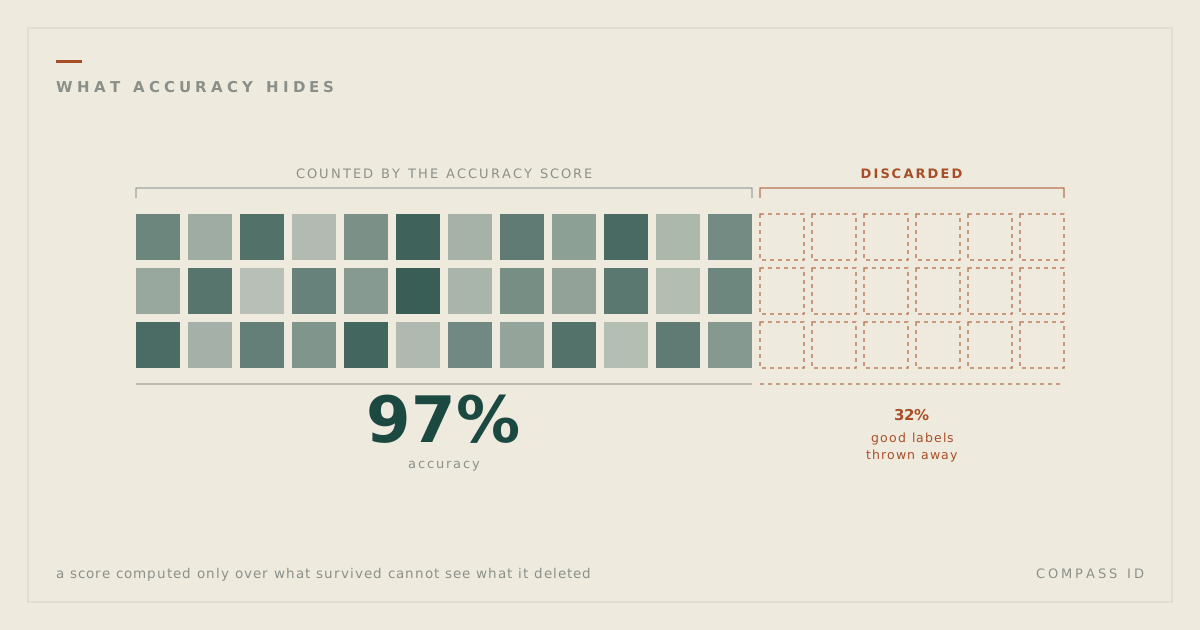
- Machine-assigned tags are wrong some of the time. Against reference sets built by an independent AI model, not a human expert, tag precision runs 81 to 86% across the published corpora, recall is deliberately lower, and each atlas states its own measured figures. We also found, and wrote up, that an accuracy score cannot see the labels a pipeline silently discards.
- A blank means no indexed research found by our search, never that no research exists. Work outside the major indexes will not appear.
- Treat deposits as material you are willing to publish. Visibility is a choice at sign-up and in settings, but this is a prototype, and unpublished or sensitive data does not belong here yet.
The useful summary is narrow. Structure one paper properly and you have a record. Structure a field and you have a map with its blank spaces marked, which is the part that tells you where to go next.